
The IAM Canada Territory
 Quebec is home to nearly half of the Canadian Territory’s total membership. Ontario–Canada’s most populated province–also boasts a strong membership of over 12,000.117 The IAM’s Air Transportation Territory only covers the United States, so Canadian workers in this industry are included in the country’s overall membership totals.
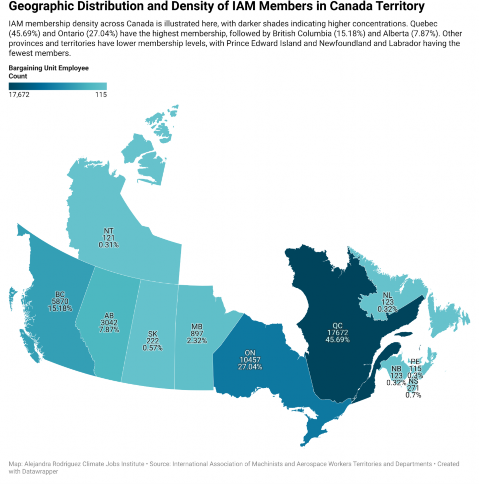
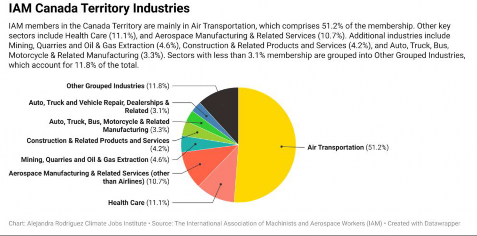
Air transportation makes up over half of all members in Canada. Aerospace Manufacturing and Related Services is also a key industry in the country, especially in Quebec. Healthcare makes up a more significant portion of IAM membership in Canada than it does in the United States, with Ontario leading the way in organizing this sector. British Columbia, which boasts the third- highest membership totals amongst Canadian provinces–has a diverse industrial composition.118
![]()
117 International Association of Machinists and Aerospace Workers, “Canada Territory Revised,” June 28, 2024.
IAM Canada Territory Industries
Climate Change Impacts on The IAM Canadian Territory
The IAM Canada region spans provinces and territories across five distinct climate zones, each facing significant impacts from climate change.119 Temperatures in Canada are increasing at twice the global average rate, with northern regions experiencing even more rapid warming.120 The primary consequences of climate change in Canada include increased frequency and severity of heat waves, reduced extreme cold events, extended growing seasons, rising sea levels, more frequent droughts and wildfires, and a shift from snow to rain.121
Industry-Specific Climate Impacts and Implications for IAM Workers in the Canadian Territory
The IAM Canada Territory encompasses various industries across several provinces and territories, each confronting distinct climate-related challenges. The “Industry-Specific Climate Impacts for IAM Workers in Canada Territory” table outlines the risks IAM workers face on the job and in their communities.
![]()
119 Lulham et al., “Canada in a Changing Climate.”
120 Bush and Lemmen, “Canada’s Changing Climate Report.”
121 Bush and Lemmen.
Industry-Specific Climate Impacts for IAM Workers in the Canada Territory
This table lists six key industries in the 1AM Canada Territory. Provinces where over 10% of 1AM members work in the industry are highlighted along with the total percentage of members in that industry (e.g. 69% of 1AM members in Quebec work in Air Transportation). The table further highlights the climate change risks in those provinces, and the climate change impacts on key industries in those areas.
Industry Provinces Climate Change Risks Climate Change Impacts
![]()
Air Transportation
Auto, Truck, Bus, Motorcycle & Related Manufacturing
Health Care
Metal, Metal Product & Machinery Manufacturing
Mining, Quarries and Oil & Gas Extraction
Other Services
Alberta (19%), British Columbia (43%), Newfoundland and Labrador (100%), Nova Scotia (76%), Ontario (39%), Quebec
(69%), Saskatchewan (33%)
Manitoba (65%), New
Brunswick (36%)
Ontario (40%)
New Brunswick (41%)
Alberta (52%), Northwest
Territories (100%)
Nova Scotia (24%)
Increased frequency of extreme weather events; Rising temperatures; Increased wildfire activity
Temperature fluctuations; Extreme weather events; Rising temperatures
Increased frequency of heatwaves; Degraded air quality; Extreme weather events
Rising temperatures; Extreme weather events
Increased frequency of extreme weather events; Melting permafrost; Rising temperatures
Increased frequency of extreme weather events; Sea level rise and storm surges
Disruptions; Damage to infrastructure; Higher cooling costs; Heat stress on workers; Reduced visibility affecting operations; Air quality issues
Changes in material performance; Adjustments needed in manufacturing processes; Supply chain disruptions; Potential damage to manufacturing facilities; Increased cooling costs in factories; Heat stress on workers
Surge in heat-related illnesses; Increased strain on emergency services; Rise in respiratory ailments; Increased demand for air filtration; Potential damage to facilities; Disruptions in patient care and medical supply chains
Increased energy costs; Heat related quality control issues; Disruptions in supply chains; Damage to large, immovable machinery
Disruptions to extraction processes; Transportation challenges; Infrastructure damage; Challenges accessing remote sites; Increased energy costs for cooling; Changes in water availability for operations
Disruptions to service delivery; Damage to service infrastructure; Flooding of coastal service facilities; Increased insurance costs for at-risk locations
Data sources: The data presented in this table is derived from multiple authoritative sources, including Government of Canada reports on climate change impacts across various regions of Canada (Lu/ham et al., 2023; Hancock er al., 2022; Sauchyn er al., 2020; Douglas & Pearson, 2022; Dietz & Arnold, 2021) and peer-reviewed research on climate vulnerability in Arctic transportation (Debortoli et al., 2019). Industry representation percentages were provided by the International Association of Machinists and Aerospace Workers (1AM) in 2024.
Table: Alejandra Rodriguez Climate Jobs Institute • Created with Datawrapper