The IAM Eastern Territory
 The IAM Eastern Territory, with nearly 50,000 members, includes some of the IAM’s most
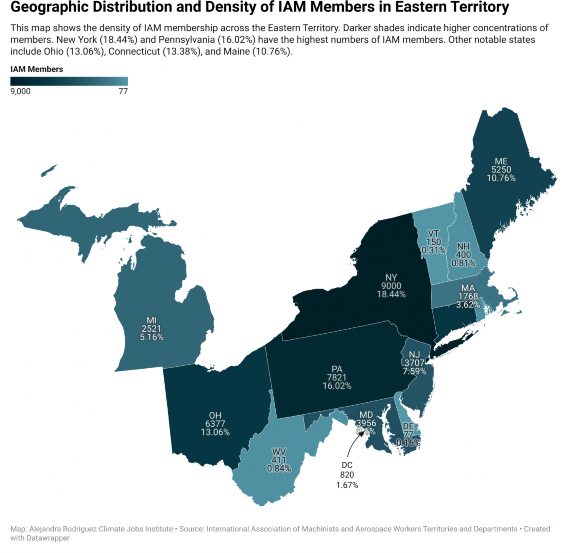
union-dense states.109 The territory includes arguably the most union-friendly state in New York,
![]()
109 International Association of Machinists and Aerospace Workers, “Eastern Territory Revised,” June 28, 2024.
the nation’s capital in Washington, DC, manufacturing hotbeds and politically-important states like Michigan, Ohio, and Pennsylvania, and West Virginia–perhaps the state most associated with fossil fuel extraction.
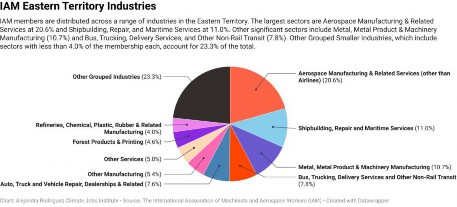
The leading industry in the Eastern Territory is Aerospace Manufacturing & Related Services, representing 20.6% of IAM members in the area.110 Shipbuilding, Repair and Maritime Services follows at 11%, reflecting significant contributions from maritime industries, especially in coastal states.
![]()
110 International Association of Machinists and Aerospace Workers.
IAM Eastern Territory Industries
Climate Change Impacts on the IAM Eastern Territory
The Eastern Territory of the IAM covers 14 states plus Washington, DC, with a wide variety of climate risks.111 These climate change impacts have significant implications for IAM members and industries across the territory.
In the Northeast region, aerospace workers in Connecticut and shipbuilders in Maine face challenges related to extreme weather events and rising temperatures.112 Massachusetts and New Jersey are experiencing rising sea levels that threaten coastal areas with flooding and erosion.113 Rhode Island faces significant risks from rising sea levels, with projections up to 4 feet by 2100.114
Inland communities are at risk, too. Pennsylvanians who live near gas extraction and industrial agriculture sites are experiencing greater air pollution.115 Changing weather on the Great Lakes affects critical shipping and port operations in places like Michigan and Ohio.116 Anywhere you go, there are serious climate risks to IAM members and their families.
Industry-Specific Climate Impacts and Implications for IAM Workers in the Eastern Territory
The “Industry-Specific Climate Impacts for IAM Workers in the Eastern Territory” table below outlines key industries within the area, detailing their presence in specific states and the potential climate change impacts. This region faces significant environmental changes, which are likely to affect operations, infrastructure, and worker safety across sectors like aerospace manufacturing, transportation, and metal products.
![]()
111 International Association of Machinists and Aerospace Workers.
112 Dupigny-Giroux et al., “Chapter 18: Northeast.”
113 Kunkel et al., “State Climate Summaries for the United States 2022.”
114 Kunkel et al.
115 Whitehead et al., “Chapter 21: Northeast.”
116 Wilson et al., “Chapter 24: Midwest.”
Industry-Specific Climate Impacts for IAM Workers in the Western Territory
This table lists nine key industries in the 1AM Eastern Territory. States where over 10% of 1AM members work in the industry are highlighted along with the total percentage of members in that industry (e.g. 91.2% of 1AM members in the District of Columbia work in the Forest Products & Printing industry). The table further highlights the climate change risks in those states, and the climate change impacts on key industries in those areas.
Industry States Climate Change Risks Climate Change Impacts
![]()
Aerospace Manufacturing & Related Services
Shipbuilding, Repair, and Maritime Services
Metal, Metal Product & Machinery Manufacturing
Bus, Trucking, Delivery Services and Other Non Rail Transit
Auto, Truck, Bus, Motorcycle & Related Manufacturing
Forest Products & Printing
Health Care
Other Manufacturing
Federal Government – National Security
Connecticut (68%), Maryland
(54%), West Virginia (30%),
Rhode Island (26%),
Michigan (18%),
Pennsylvania (13%), Ohio
(13%), New York (10%)
Connecticut (11%), Maine
(86%)
Ohio (29%), Michigan {15%),
Pennsylvania (12%), Vermont (58%), New York (12%), Connecticut (12%)
Delaware (88%), Michigan
(15%), New Jersey (12%),
Massachusetts (12%),
Michigan (15%), New Hampshire (18%), New York (14%)
Pennsylvania (18%)
District of Columbia (97 %), Michigan (10%)
Rhode Island (42%), New York (11%)
Vermont (38%),
Massachusetts (15%),
Michigan (12%), West
Virginia (12%)
Maryland (12%), New
Hampshire (66%)
Rising temperatures; Extreme weather events; Sea level rise
Rising sea levels; Increased storm intensity; Changes in sea temperature and currents
Rising temperatures; Extreme weather events
Rising temperatures; Extreme weather events; Increased precipitation
Rising temperatures; Extreme weather events; Increased frequency of floods
Increased frequency of wildfires; Increased pest activity; Changes in precipitation patterns
Increased frequency of extreme heat events; Extreme weather events
Increased frequency of extreme heat events; Changes in precipitation patterns
Increased frequency of extreme heat events; Extreme weather events
Increased cooling costs and heat stress; Production and supply chain disruptions; Flooding risks
Flooding of coastal infrastructure; More frequent damage to vessels; Changes in ship design
Increased energy costs and quality control issues; Supply chain disruptions and equipment damage
Higher vehicle maintenace cost and quality control issues; Route disruptions and delays; Costs stemming from the transition to low emission vehicles
Increased cooling costs in plants; Supply chain disruptions; Need for flood resistant manufacturing facilities
Reduced timber quality and quantity; Changes in wood fiber characteristics affecting paper quality; Variability in wood and pulp supply
Surge in heat-related illnesses and hospital admissions; Potential damage to facilities
Increased cooling costs and productivity losses; Sudden changes in water availability for manufacturing
Increased cooling costs and heat stress on personnel; Potential damage to military installations
Data sources: Climate impacts and risks are summarized from the NOAA National Centers for Environmental Information State Climate Summaries 2022 and various chapters of the Fifth National Climate Assessment (2023). Industry representation percentages were provided by the International Association of Machinists and Aerospace Workers (1AM).
Table: Alejandra Rodriguez Climate Jobs Institute• Created with Datawrapper